Key Takeaways
- AI code generation speeds up task completion by 55% but increases PR review times by 91%, so teams need segmented metrics to remove the validation bottleneck.
- Track 10 core metrics, including 30-50% cycle time reduction, review iterations dropping to 1.5, and CI failure resolution that runs 60% faster.
- Auto-fix tools like Gitar outperform suggestion-only engines by resolving CI failures and applying fixes automatically, with 80%+ fix acceptance rates.
- Teams using Gitar often save more than $750K per year for 20 developers through fewer context switches, zero tool costs, and 50%+ faster cycles.
- Install Gitar now for free enterprise-grade AI code review, auto-fixes, and instant metric baselines across unlimited repositories.
1. Cycle Time Reduction for AI-Heavy PRs
Cycle time tracks how long it takes a pull request to move from creation to merge. AI-generated code often stretches review cycles because reviewers must validate more complex changes. Research with 4,800 developers shows Copilot users complete tasks 55% faster, yet PR review times increased 91% when teams lacked automated fixes.
Teams using auto-fix tools in 2026 typically see 30-50% cycle time reduction compared to suggestion-only tools. Measure cycle time through GitHub Insights or GitLab analytics, and always separate AI-labeled PRs from human-written code. Capture a 3-month baseline before rollout, then monitor cycle time monthly after enabling auto-fixes.
Many teams skip segmentation between AI and human PRs, which hides the real impact of AI. Gitar’s auto-fix capabilities usually cut cycle times by more than 50% by resolving CI failures immediately and applying review feedback automatically.
2. AI Comment Acceptance Rate for Suggested Changes
AI Comment Acceptance Rate shows what percentage of AI-generated suggestions developers actually apply. This metric highlights whether AI comments deliver value or just add noise. Industry data shows less than 44% of AI-generated code is accepted without modification.
Strong AI tools push this rate above 50%. Measure it with analytics dashboards or manual tracking that compares implemented suggestions to total recommendations. Review this data by repository and team to understand adoption patterns.
The biggest mistake is counting suggestions that never pass CI. Tools with strong context engines and validation pipelines test suggestions before surfacing them, which raises acceptance rates and reduces rework.
3. Fix Acceptance Rate for Auto-Applied Changes
Fix Acceptance Rate tracks the percentage of automatically applied fixes that merge successfully without reversion. This metric separates true healing engines from simple suggestion tools by focusing on resolved problems, not just proposed edits. Fix acceptance proves that automation delivers real value.
Industry benchmarks show 80% or higher acceptance rates for CI-validated auto-fixes. Teams usually see this metric improve quickly during an auto-fix trial as the system learns from their codebase.
Problems arise when tools apply fixes without CI validation, which often breaks builds and frustrates developers. Running CI checks before applying fixes keeps acceptance rates high and protects developer trust.
4. Review Iterations per Pull Request
Review iterations per PR count how many push cycles occur before approval. AI-generated code often increases iteration counts because reviewers question logic, style, and integration safety. Pre-AI teams averaged about 3.2 iterations per PR, while AI-assisted development without auto-fixes averages 5.1 iterations.
Gitar typically reduces review iterations to about 1.5 by applying reviewer feedback automatically and fixing CI failures before human review. Measure this metric through GitLab merge request analytics or GitHub PR tracking, and separate AI-authored PRs from human-authored ones.
Many teams accidentally include automated fix pushes in their iteration counts, which inflates the numbers. Track only human-initiated review cycles when comparing pre-AI and post-implementation performance.
5. Defect Density After Merge
Defect density measures confirmed bugs per thousand lines of code after a merge. AI-generated code shows 75% more logic issues than human-written code, so post-merge quality tracking becomes critical for AI-heavy teams.
Teams that pair AI code review with auto-fix capabilities often see a 20% reduction in defect density. Measure this with post-merge scanners, bug trackers, and production monitoring, and always tag issues by code authorship type.
Many teams mix pre-merge findings with post-merge escapes, which hides real risk. Focus on production defects that reach users, not issues caught during review or CI.
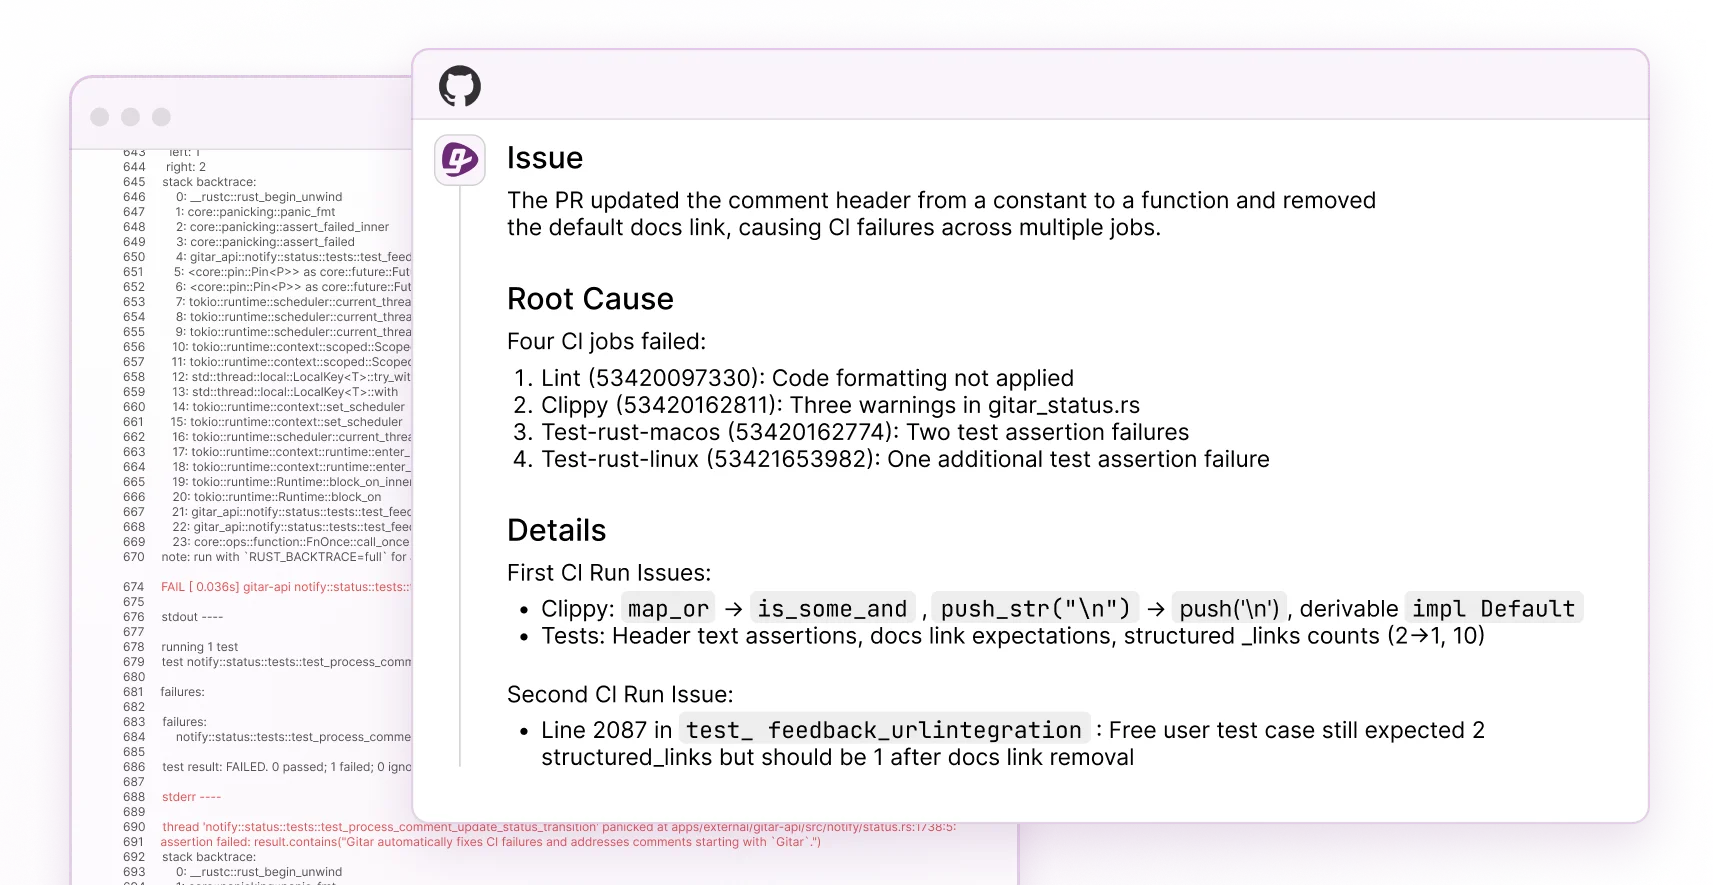
6. CI Failure Resolution Time for AI PRs
CI Failure Resolution Time tracks how long it takes to move from a failed build to a green pipeline. AI-generated PRs often trigger more CI failures because they touch more files and integrations. Traditional resolution forces developers to stop feature work and debug pipelines manually.
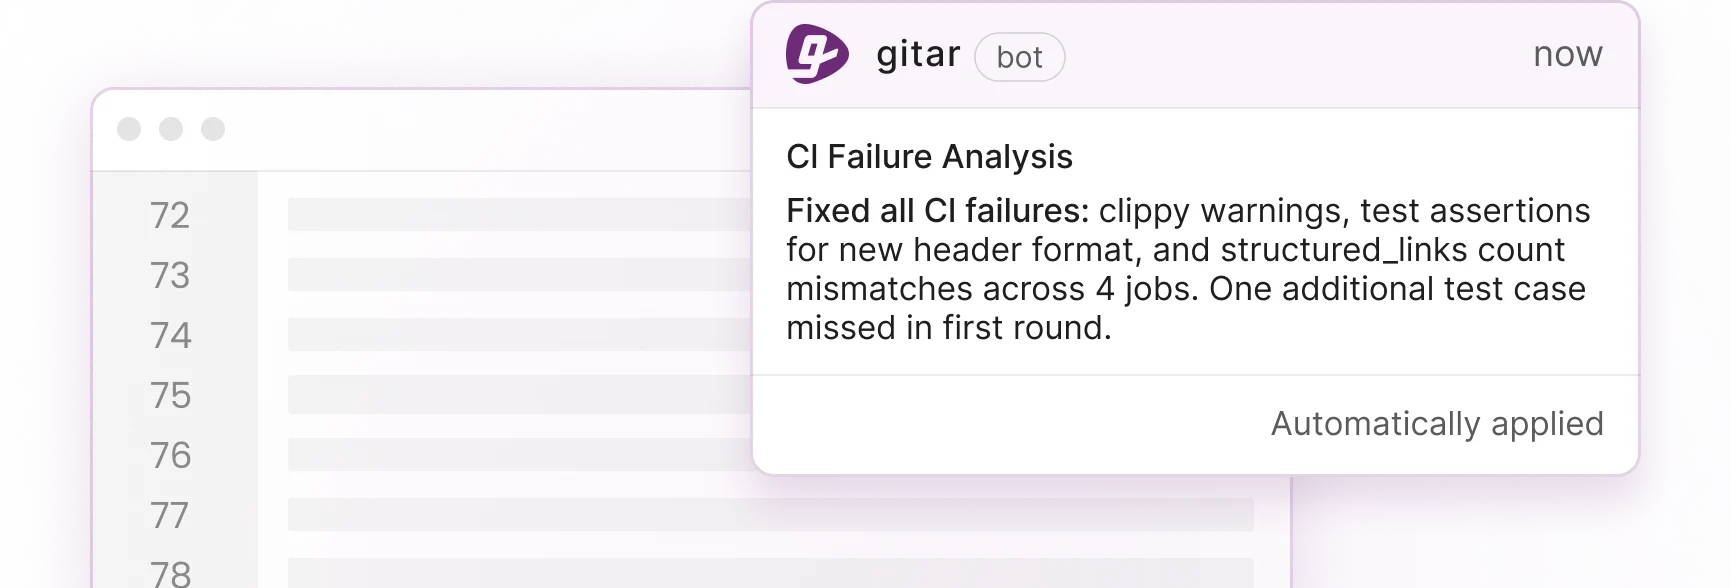
Auto-fix tools like Gitar usually cut resolution time by about 60%. The platform reads failure logs, generates validated fixes, and commits solutions automatically. Measure this metric through CI analytics by tracking the time from failure to green across different failure categories.
Install Gitar now to automatically fix broken builds and remove most CI-driven interruptions. Track this metric during your free trial to quantify immediate productivity gains.
7. Pull Request Throughput per Engineer
PR throughput measures how many pull requests each team member processes per day. GitHub activity shows a 25% year-over-year increase in annual commits, which reflects AI-driven throughput growth.
Teams often expect about a 25% throughput increase with AI coding tools, but review bottlenecks can cap those gains. Gitar’s auto-fix engine helps teams sustain higher throughput by removing CI delays and reducing review friction.
8. Merge Approval Rate on First Review
Merge approval rate tracks the percentage of PRs that pass on the first review without requested changes. Copilot-assisted code shows 11% improved merge rates because initial quality improves.
Teams that add auto-fix tools often see further gains because CI issues disappear before reviewers look at the code. Measure this with GitHub or GitLab analytics by comparing first-pass approval rates before and after enabling auto-fixes.
9. Developer Context Switching Frequency
Context switching frequency tracks how often developers get pulled away from focused work by CI failures, review requests, and build issues. AI-generated code can increase these interruptions because it introduces more failures and complex reviews.
Gitar reduces context switching to near-zero by sending single-comment updates and resolving many issues automatically. Developers receive consolidated notifications and can stay focused on feature delivery instead of maintenance firefighting.
10. Velocity Impact Score Across Sprints
Velocity Impact Score measures story points delivered per sprint while adjusting for quality. Industry reports show 10-30% velocity gains when teams adopt comprehensive AI development tools.
Calculate this score by tracking sprint completion rates and then subtracting the impact of post-release defects and rework. Teams using Gitar often see sustained velocity gains because reviews move faster and automated checks catch more issues early.
Enterprise AI Code Review: Gitar vs Paid Suggestion Engines
Most current tools charge $15-30 per developer each month for suggestion-only features that still require manual implementation. These tools create ongoing costs without guaranteeing faster merges or fewer failures.
| Capability | CodeRabbit/Greptile | Gitar |
|---|---|---|
| Auto-apply fixes | No | Yes (free trial) |
| CI auto-resolve | No | Yes |
| Single-comment updates | No | Yes |
| Enterprise scale | Available with paid plans | Free unlimited repos |
Gitar offers free code review for unlimited repositories with Pinterest-scale performance, handling more than 50M lines of code and thousands of daily PRs. Install Gitar now to access enterprise-grade capabilities without per-seat fees.
4 Practical Phases to Baseline and Scale Gitar
Phase 1 starts with installing the Gitar GitHub or GitLab integration in about 30 seconds, with no account setup required. Phase 2 focuses on building a 3-month baseline for all 10 metrics before enabling auto-fixes. Phase 3 activates the auto-fix trial so you can measure immediate impact on cycle time and CI resolution. Phase 4 rolls out analytics dashboards and workflow automation to maintain long-term improvement.
The main implementation risk comes from mixing AI and human data in a single view. Keep separate tracking streams so ROI calculations and stakeholder reports stay accurate.
ROI Summary for a 20-Developer Team
A 20-developer team using AI code review with auto-fix capabilities can unlock clear productivity gains and cost savings.
| Metric | Pre-Gitar | Post-Gitar | Annual Savings |
|---|---|---|---|
| CI/review time per developer | 1 hour/day | 15 min/day | $750K |
| Tool costs | $450-900/month | $0 | $5.4K-$10.8K |
| Context switching interrupts | Multiple daily | Near-zero | $250K |
Install Gitar now, automatically fix broken builds, and start shipping higher quality software faster to capture ROI immediately without upfront costs or seat limits.
Frequently Asked Questions
What are the top free AI code review tools for enterprise teams?
Gitar leads the free enterprise AI code review market with unlimited repository support, auto-fix capabilities, and deep CI integration. Paid tools like CodeRabbit ($15-30 per seat) or Greptile ($30 per seat) focus on suggestions, while Gitar applies fixes automatically. The platform supports Pinterest-scale workloads with more than 50M lines of code and thousands of PRs while staying free for code review. Other tools such as Windsurf provide advanced coding assistance and AI pair programming but lack the dedicated PR review features large teams require.
How do you measure AI fix acceptance rates effectively?
Measure fix acceptance by tracking the percentage of automatically applied fixes that merge without reversion or manual edits. Use analytics dashboards to monitor acceptance across lint errors, test failures, and build breaks. Segment results by CI system, repository, and team so you can spot patterns and outliers. Effective measurement depends on CI validation before applying fixes, and teams should avoid counting unvalidated suggestions that fail integration tests.
What are the essential code review metrics for enterprise AI-assisted teams?
Enterprise teams should focus on cycle time reduction, fix acceptance rate, review iterations per PR, defect density after merge, and CI failure resolution time. These metrics connect directly to productivity and quality in AI-assisted environments. Establish a 3-month baseline before enabling auto-fix tools, then track improvements monthly. Always separate AI-generated code from human-written code so ROI calculations stay accurate. Teams that adopt comprehensive auto-fix workflows often see 30-50% cycle time reductions and 60% faster CI resolution.
Which metrics best demonstrate AI code review ROI to executives?
Velocity Impact Score and cycle time reduction usually resonate most with executives. Calculate annual productivity savings by multiplying time saved per developer by team size and hourly rates. Include a comparison of tool costs that highlights Gitar’s free model against paid tools that charge $15-30 per seat each month. Present defect density improvements and fewer CI failures as quality gains that lower technical debt and customer-facing incidents. Use concrete figures such as $750K annual savings for a 20-developer team to anchor the business case.
How has AI adoption changed code review performance since 2025?
By 2026, AI adoption reached about 84% of developers, which drove a 91% increase in PR review times even as task completion sped up by 55%. Monthly GitHub PR volume grew 23% year over year, which overwhelmed traditional review workflows. Teams without auto-fix tools now see about 5.1 review iterations per PR compared to 3.2 before AI. Teams that use comprehensive AI code review with auto-fixing typically reach 1.5 review iterations, 50% cycle time reduction, and 60% faster CI resolution. The key shift comes from moving away from suggestion-only tools toward healing engines that fix code automatically.
Conclusion: Turning AI Code Review into Measurable ROI
AI coding tools solved code generation but created review bottlenecks that traditional metrics miss. The 10 metrics in this guide give engineering leaders a clear framework to prove ROI, improve team performance, and justify AI investments to executives. Success depends on segmented measurement, solid baselines, and tools that move beyond suggestions to real problem resolution. Gitar commoditizes code review and delivers measurable productivity gains through automated fixes and rich analytics.