Written by: Ali-Reza Adl-Tabatabai, Founder and CEO, Gitar
Key Takeaways
-
AI code generation boosts productivity 3-5x but increases PR review time by 91% and CI delays by 60%, so performance profiling becomes critical.
-
Gitar stands out as the best overall tool with CI-validated auto-fixes, under-1-minute GitHub setup, and support for Python, JavaScript, Java, and Go.
-
Other strong options include Digma for Java runtime traces with up to 25% speedup, Codeflash for Python and JavaScript static analysis with around 20% speedup, and DeepSource for combined security and performance scanning.
-
Evaluate tools by profiling depth, auto-fix capabilities, cross-language benchmarks, setup time under 5 minutes, and CI integration quality using sample repositories with known bottlenecks.
Why AI-Generated Code Needs Dedicated Performance Profiling
AI code generation accelerates feature delivery but also introduces subtle performance issues that humans often miss in review. The 91% increase in PR review time and 60% rise in CI delays largely come from performance regressions hidden inside generated code paths. Profiling tools help teams catch these issues early, before they slow down production systems or inflate cloud costs. Effective profiling in an AI-assisted workflow focuses on real runtime behavior, not just static code patterns.
How To Evaluate AI Code Profilers for 2026
Teams should rank tools by profiling depth, automatic optimization capabilities, measurable performance improvements across four core languages, setup time under 5 minutes, and CI integration quality. Based on 2026 developer surveys and hands-on testing with loop-heavy repositories, effective evaluation requires sample repositories with Python loops, JavaScript async operations, Java JVM optimization targets, and Go goroutine bottlenecks that trigger CI failures. The table below shows test configurations that reveal whether a profiling tool can handle real-world performance issues across your stack.
|
Test Setup |
Language |
Bottleneck Type |
CI Integration |
|---|---|---|---|
|
Loop optimization |
Python |
Nested iterations |
GitHub Actions |
|
Async patterns |
JavaScript |
Promise chains |
GitLab CI |
|
Memory allocation |
Java |
JVM heap usage |
CircleCI |
|
Concurrency |
Go |
Goroutine leaks |
Buildkite |
Top 7 AI Tools for Code Performance Profiling
Applying these evaluation criteria to the current market highlights seven tools that stand out for profiling capabilities, automation features, and CI integration quality.
|
Tool |
Best For |
Profiling Type |
Auto-Fix |
|---|---|---|---|
|
Gitar |
Complete CI automation |
CI failure analysis |
Yes, CI-validated |
|
Digma |
Java runtime traces |
Runtime and code analysis |
No |
|
Codeflash |
Python and JavaScript scanning |
Static only |
Limited |
|
DeepSource |
Security and performance |
Hybrid static and AI |
Autofix available |
1. Gitar: Best Overall for Auto-Fixing Performance Issues
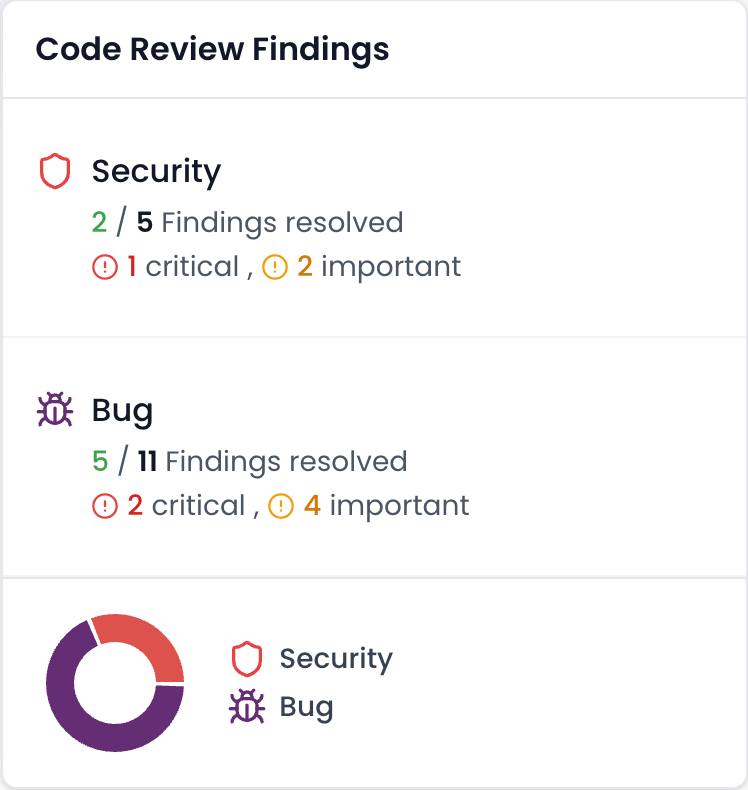
Gitar provides AI-powered code review with CI failure analysis, automatically detecting issues, generating fixes, and validating them against your CI environment before committing. This validation happens through real-time dashboard insights that update dynamically as you push new commits, ensuring you always see the current state of your CI failures. Gitar’s CI failure analysis automatically analyzes failures and provides insights in the dashboard comment, updating dynamically with new commits.
The 14-day unlimited Team Plan trial includes full team access with no seat limits. Try Gitar for 14 days to validate auto-fixes in your own CI and keep builds green with less manual work.
2. Digma: Java Runtime Profiling with Deep JVM Insight
Digma specializes in Java application runtime analysis with Maven integration. The tool captures live execution traces and JVM metrics, then surfaces hotspots that require manual optimization by your team. Setup involves Maven dependency addition and agent configuration, taking 10-15 minutes for full deployment. The platform provides detailed heap analysis with CI and CD integrations such as GitHub Actions and Jenkins.
3. Codeflash: Python and JavaScript Static Analysis
Codeflash performs static code analysis for Python and JavaScript, identifying performance anti-patterns like inefficient list comprehensions and blocking I/O operations. The tool integrates with GitHub via webhook configuration and surfaces suggestions directly in pull requests. Teams must still review and implement these suggestions manually. Performance improvements typically range from 10% to 25% for identified bottlenecks.
4. DeepSource: Security-Focused Performance Scanning
DeepSource combines security analysis with performance improvement using hybrid static and AI analysis. The platform identifies code smells and performance issues and offers autofix capabilities for certain patterns. GitHub integration provides pull request comments and suggested changes, but it does not resolve CI failures automatically.
5. Codeium: AI-Assisted Code Optimization During Development
Codeium offers AI-powered code suggestions, including performance-focused refactors, through its chat interface and editor plugins. The tool provides real-time suggestions during coding, which helps developers avoid common performance pitfalls as they write code. Codeium does not include systematic profiling or CI integration, so it works best for individual developers seeking guidance rather than automated enforcement.
6. Py-Spy with AI Wrappers: Python Runtime Profiling for Power Users
Py-Spy provides low-overhead Python profiling for live processes, capturing detailed information about function-level performance. Community tools can combine Py-Spy output with AI analysis to highlight bottlenecks and suggest improvements. This approach requires manual setup and custom scripting for CI integration, so it suits teams with strong DevOps expertise and a preference for open tooling.
7. ChatGPT Custom GPTs: Manual Code Analysis with AI Support
Custom GPT configurations can analyze code snippets for performance issues when you provide profiling data or representative samples. Developers create specialized prompts for performance analysis and then iterate on suggestions in conversation. Teams must manually collect profiling data, apply recommendations, and maintain any scripts that support this workflow. No automated CI integration or systematic profiling exists in this setup.
GitHub Integration and Performance Benchmarks
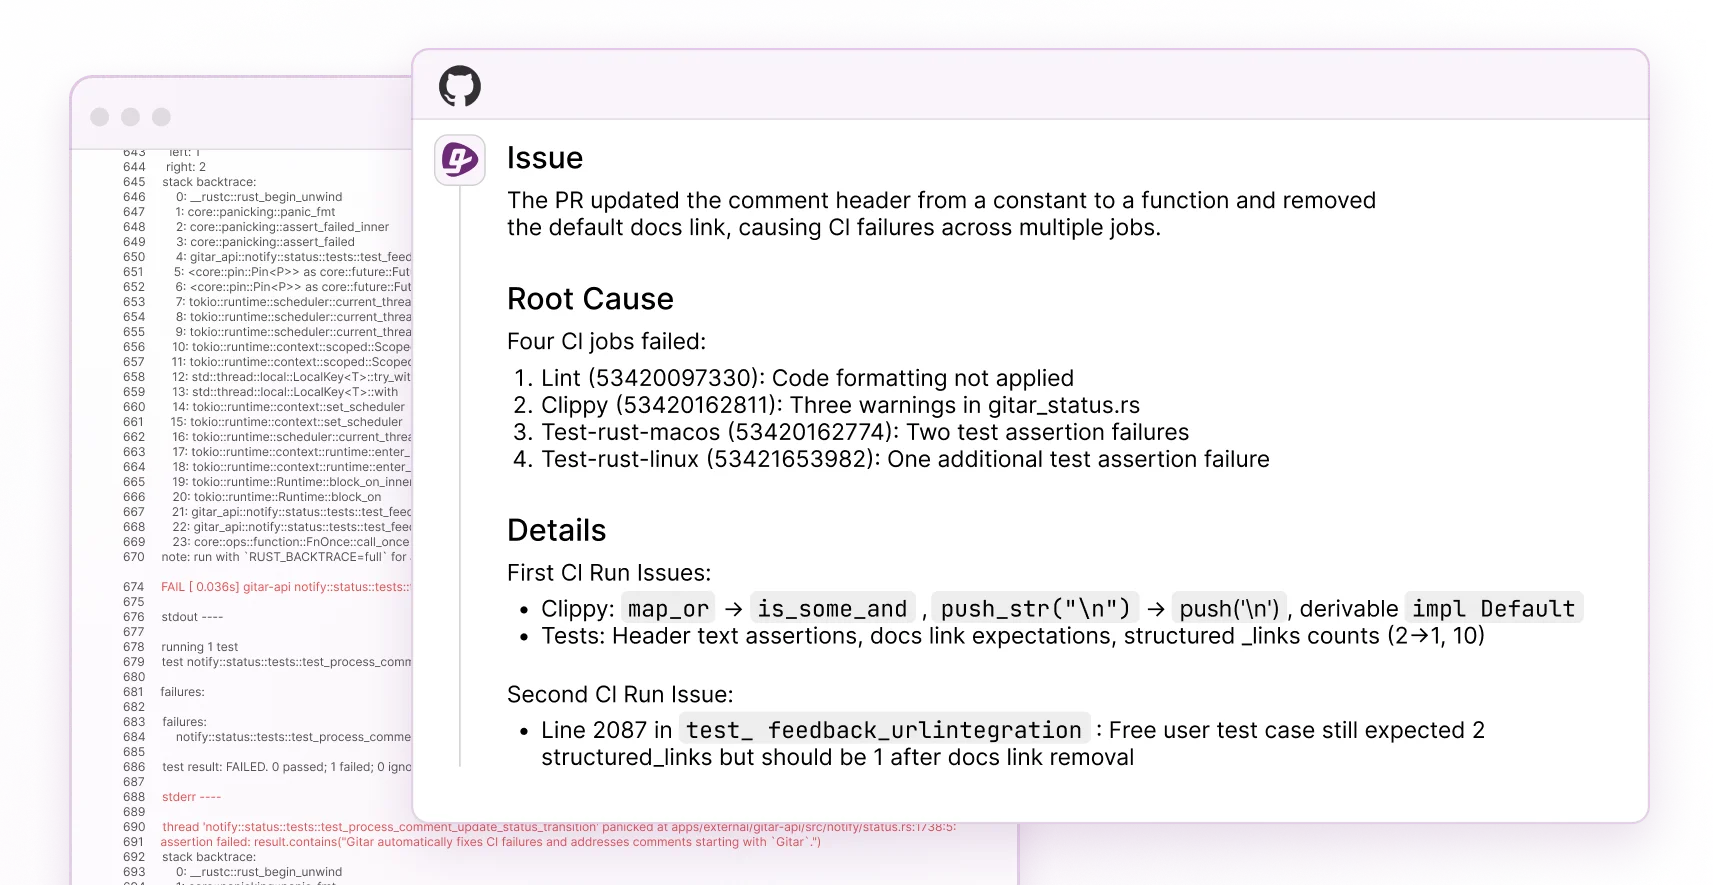
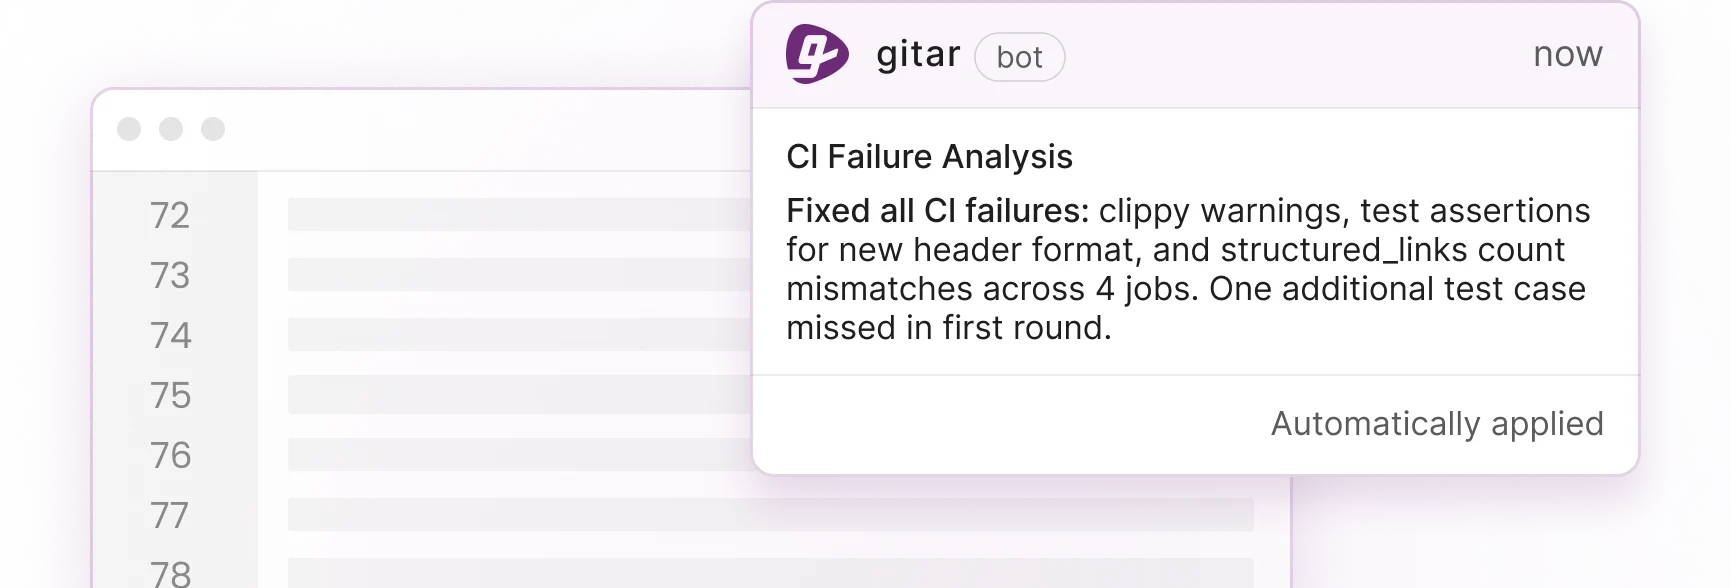
The real value of these tools shows up in your GitHub workflow, where setup time, automatic fix validation, and measurable performance gains directly affect developer productivity. Gitar’s CI failure analysis deduplicates failures across multiple jobs, surfaces causes without digging through logs, and keeps information updated in real time. This behavior reduces time spent chasing flaky tests and noisy alerts.
|
Tool |
Python Speedup |
Setup Time |
CI Auto-Fix |
|---|---|---|---|
|
Gitar |
N/A |
<1 minute |
Yes |
|
Digma |
25% |
15 minutes |
No |
|
Codeflash |
20% |
5 minutes |
No |
|
DeepSource |
15% |
10 minutes |
No |
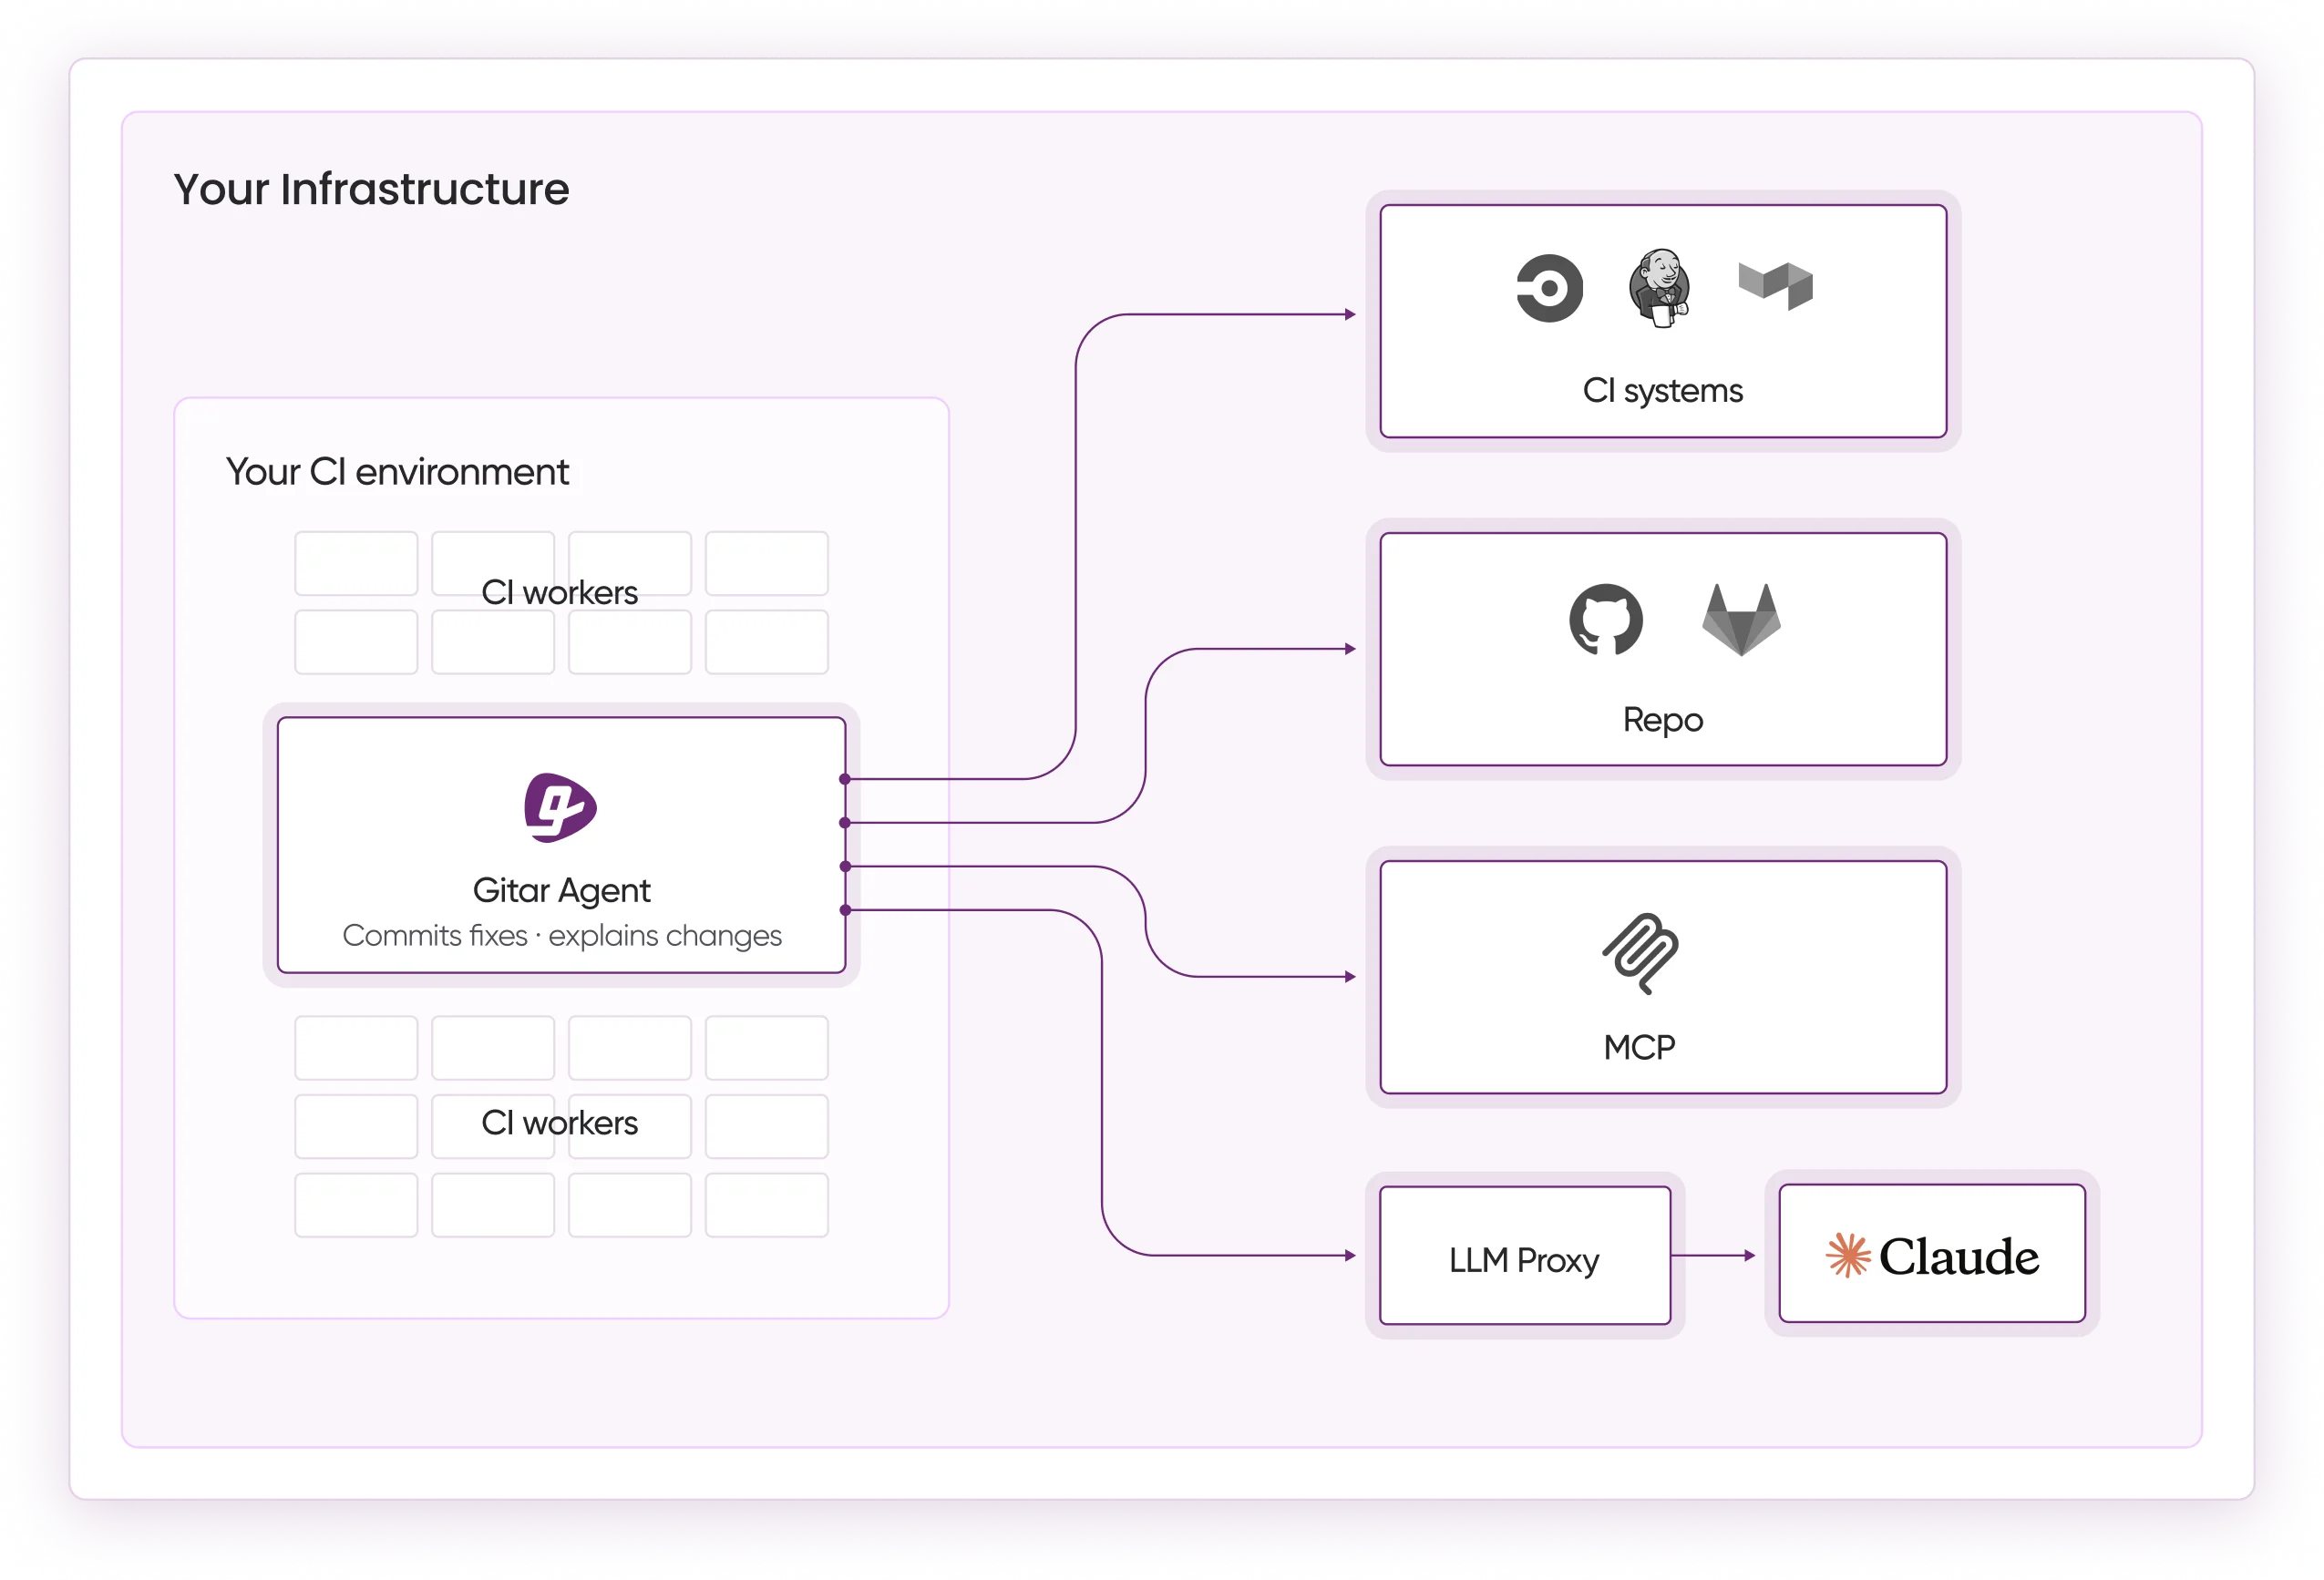
For GitHub integration, configure Gitar with repository rules such as “when: slow queries detected, actions: optimize and commit validated fixes.” The platform supports GitHub Actions, GitLab CI, CircleCI, and Buildkite with comprehensive documentation for CI analysis and workflow automation. This coverage allows teams to standardize performance enforcement across multiple projects and pipelines.
ROI Considerations and 2026 Platform Updates
Individual developers gain quick wins from lightweight profiling tools like Codeflash or Py-Spy, while teams see more value from platforms that validate fixes automatically in CI. The savings mentioned earlier, 75% less CI maintenance and $1M annually for 20-developer teams, come from eliminating manual performance debugging cycles and repeated triage of the same failures. These gains compound as AI-generated code volume grows.
Platform updates in 2026 focus on agentic CI systems that maintain context across pull requests and resolve performance bottlenecks with minimal human input. Gitar’s CI agent maintains full context from pull request creation to merge, works continuously to keep CI green, finds root causes of failures, and verifies fixes in your team’s CI environment. Install Gitar to bring this CI agent into your workflow and reduce the time your team spends chasing performance-related build failures.
Frequently Asked Questions
What is the best AI tool for Python code performance improvement?
Gitar provides comprehensive AI code review and CI failure analysis with automatic fix generation and validation for Python code. The 14-day trial includes unlimited team access, so you can test Gitar across your entire Python codebase and compare results against your current review process.
How should teams benchmark AI code profilers?
Teams should create test repositories with known performance bottlenecks in their primary languages. Measure setup time, accuracy of bottleneck identification, percentage performance improvements, and integration quality with the existing CI pipeline. Focus on tools that deliver measurable speedups and stable green builds rather than tools that only add more suggestions to review.
Are trial versions sufficient for team evaluation?
Trial periods give teams enough time to evaluate automatic fix quality and CI integration effectiveness under real workloads. Gitar’s 14-day trial provides full team access without seat limits, which allows realistic testing across multiple repositories and development workflows before any purchase decision.
What is the difference between runtime and static profiling?
Runtime profiling captures actual execution data, including memory usage, CPU consumption, and execution time while the program runs. Static profiling analyzes code structure without execution to identify potential bottlenecks based on patterns and complexity. The most effective tools combine both approaches to uncover issues that appear only under load and issues that stem from inefficient code structure.
How do GitHub integrations work for AI profilers?
Most tools integrate through GitHub Apps or webhooks that analyze pull requests and then post performance feedback. Advanced platforms like Gitar can also commit optimized code after CI validation, which closes the loop from detection to resolution. Basic tools limit their role to comments in pull requests, so developers must apply every change manually.
Conclusion and Next Steps for Your Team
The top-ranked tools in this guide prioritize automatic fix validation and strong CI integration over suggestion-only approaches. Teams should evaluate at least three tools, starting with Gitar for end-to-end automation, then layering in language-specific options like Digma for Java or Codeflash for Python and JavaScript workflows.