Written by: Ali-Reza Adl-Tabatabai, Founder and CEO, Gitar
Key Takeaways
- AI coding tools increase code generation 3–5x and create review bottlenecks that can cost teams up to $1M annually in lost productivity.
- 91% of developers use AI, which drives 60% more PRs and a 29% increase in merged pull requests, overwhelming manual reviews.
- Track 9 specific metrics across quality (defect density, escaped bugs), efficiency (cycle time, MTTR), and DevEx (review fatigue, notifications) with 2026 baselines showing 40–75% improvements from automation.
- Avoid vanity metrics like PR counts or suggestion acceptance and focus on outcomes like DORA change failure rate and human toil reduction for meaningful ROI.
- Baseline your metrics and prove automation impact with a free 14-day Gitar Team Plan trial, which includes auto-fixes and guaranteed green builds.
The Problem: Post-AI Code Review Bottlenecks Stalling Your Velocity
The AI coding revolution created an unexpected bottleneck. DX’s Q4 2025 analysis of 135,000 developers confirmed the widespread adoption noted above, with daily AI users merging significantly more pull requests than light users. At the same time, GitHub’s Octoverse report documents a 29% year-over-year increase in merged pull requests, creating “commit inflation” from AI tools that drive larger and more frequent PRs.
The downstream impact is severe. The 2025 DORA report found more than 50% of teams deploy less than once a week, with 15% needing over a week to recover from deployment failures, which reflects how fragile many pipelines have become. CodeRabbit’s December 2025 report revealed AI-coauthored PRs have 1.7× more issues than human-only PRs, which helps explain the growing instability. 30% of developers report little to no trust in AI-generated code, contributing to a “verification tax”. This distrust forces teams to spend extra time re-checking AI output, which slows reviews and delays deployments even further.
As noted above, traditional activity metrics like PR counts fail to capture this reality. Engineering leaders need outcome-focused measurements that tie automation investments to measurable velocity and quality improvements. Without proper measurement, teams risk implementing expensive suggestion-only tools that create notification spam without delivering real fixes.
The Solution: Code Review Automation with Gitar’s Healing Engine
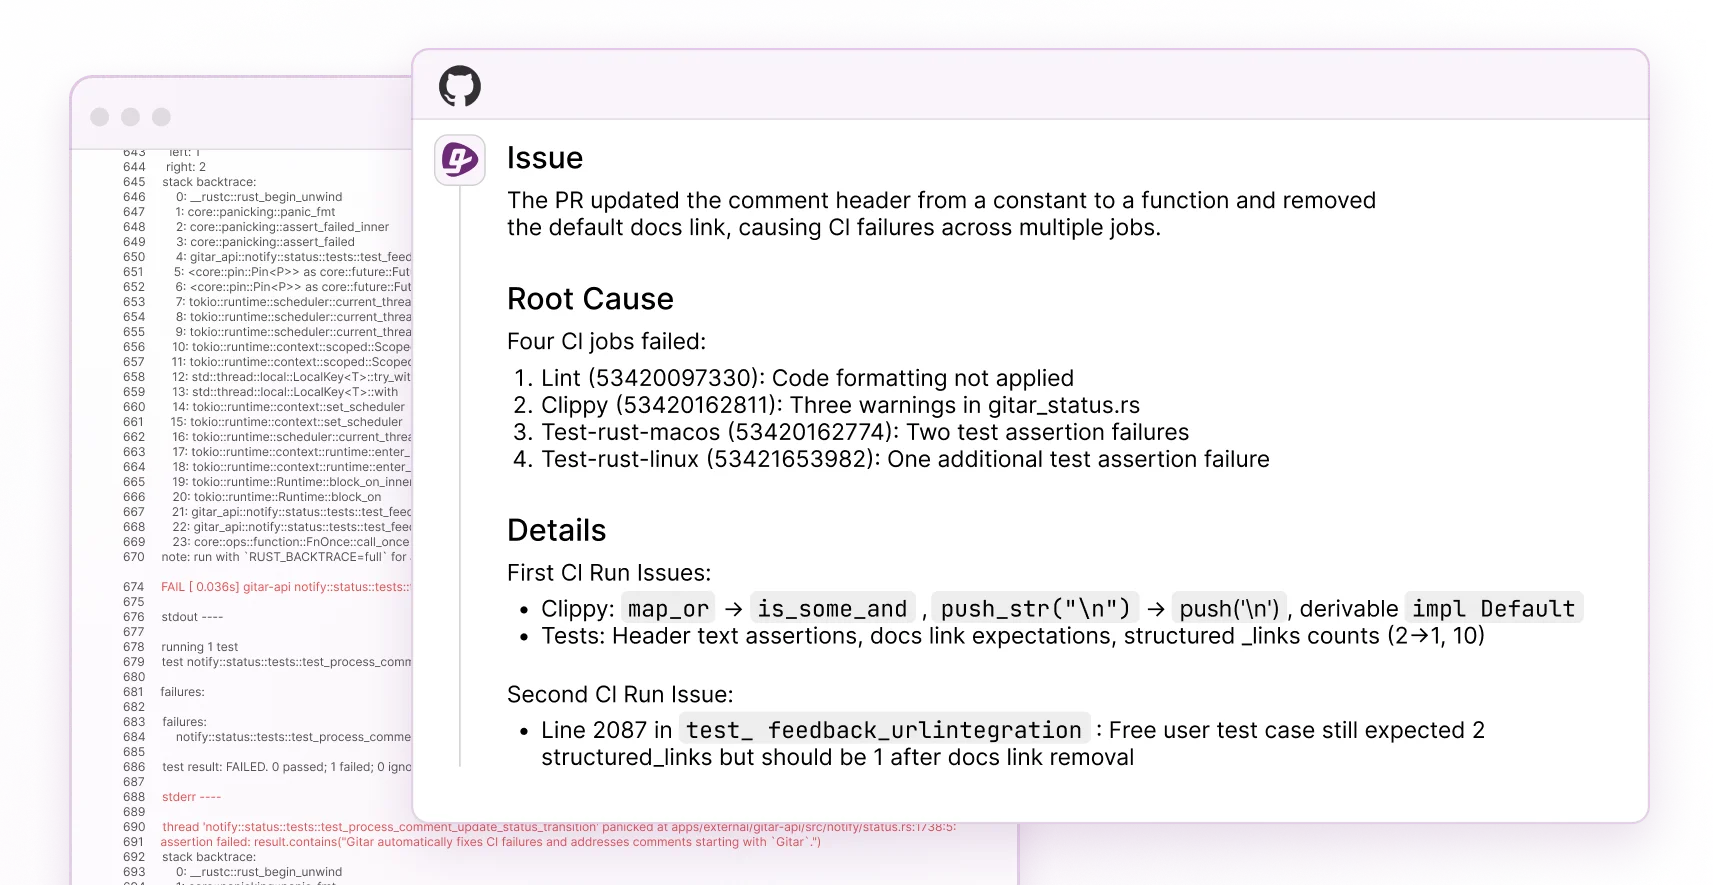
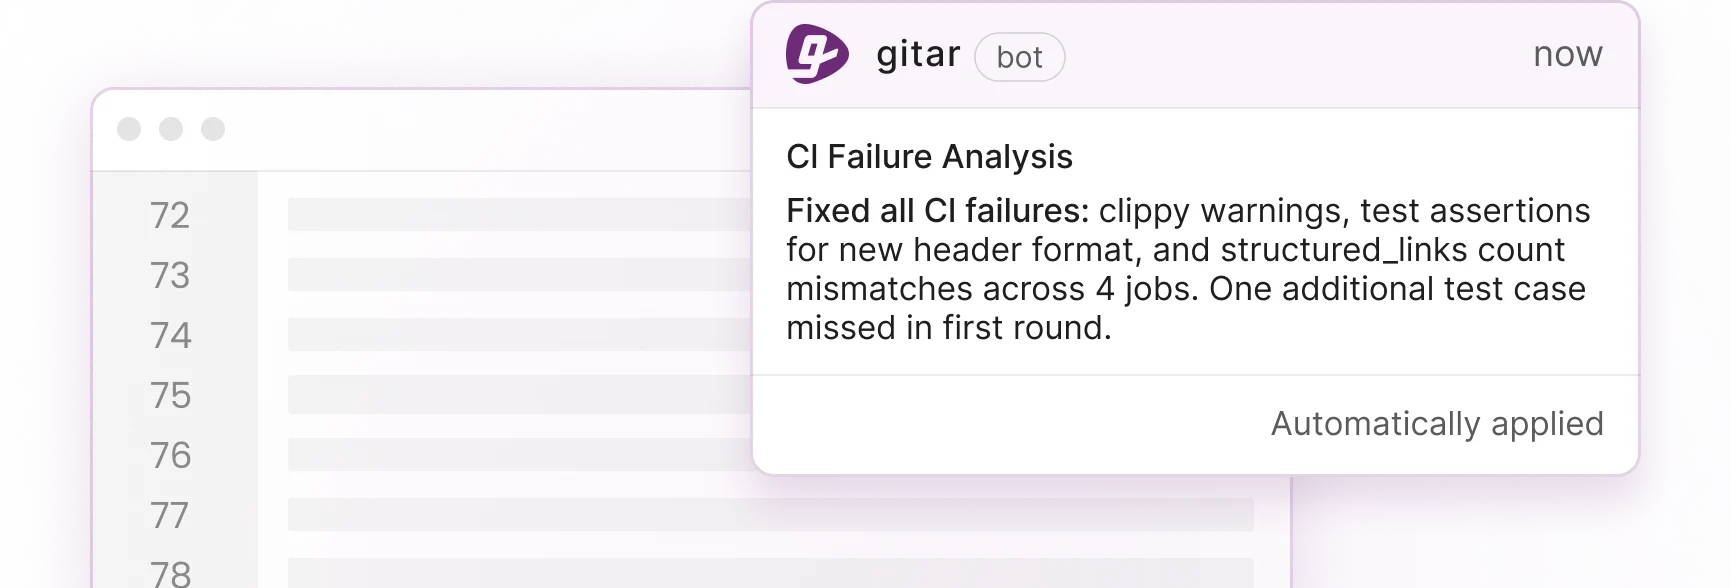
To enable accurate measurement of these outcomes, code review automation must move beyond suggestion-only approaches that generate unmeasurable noise. Gitar’s healing engine addresses the AI bottleneck by automatically fixing issues rather than just identifying them, which creates clear before-and-after metrics for every intervention.
Gitar validates each fix against CI and guarantees green builds, instead of leaving teams with comments that still require manual work. Unlike suggestion-only competitors that charge $15–30 per developer for comments requiring manual implementation, Gitar delivers validated fixes that land cleanly. For more details, see the Gitar documentation.
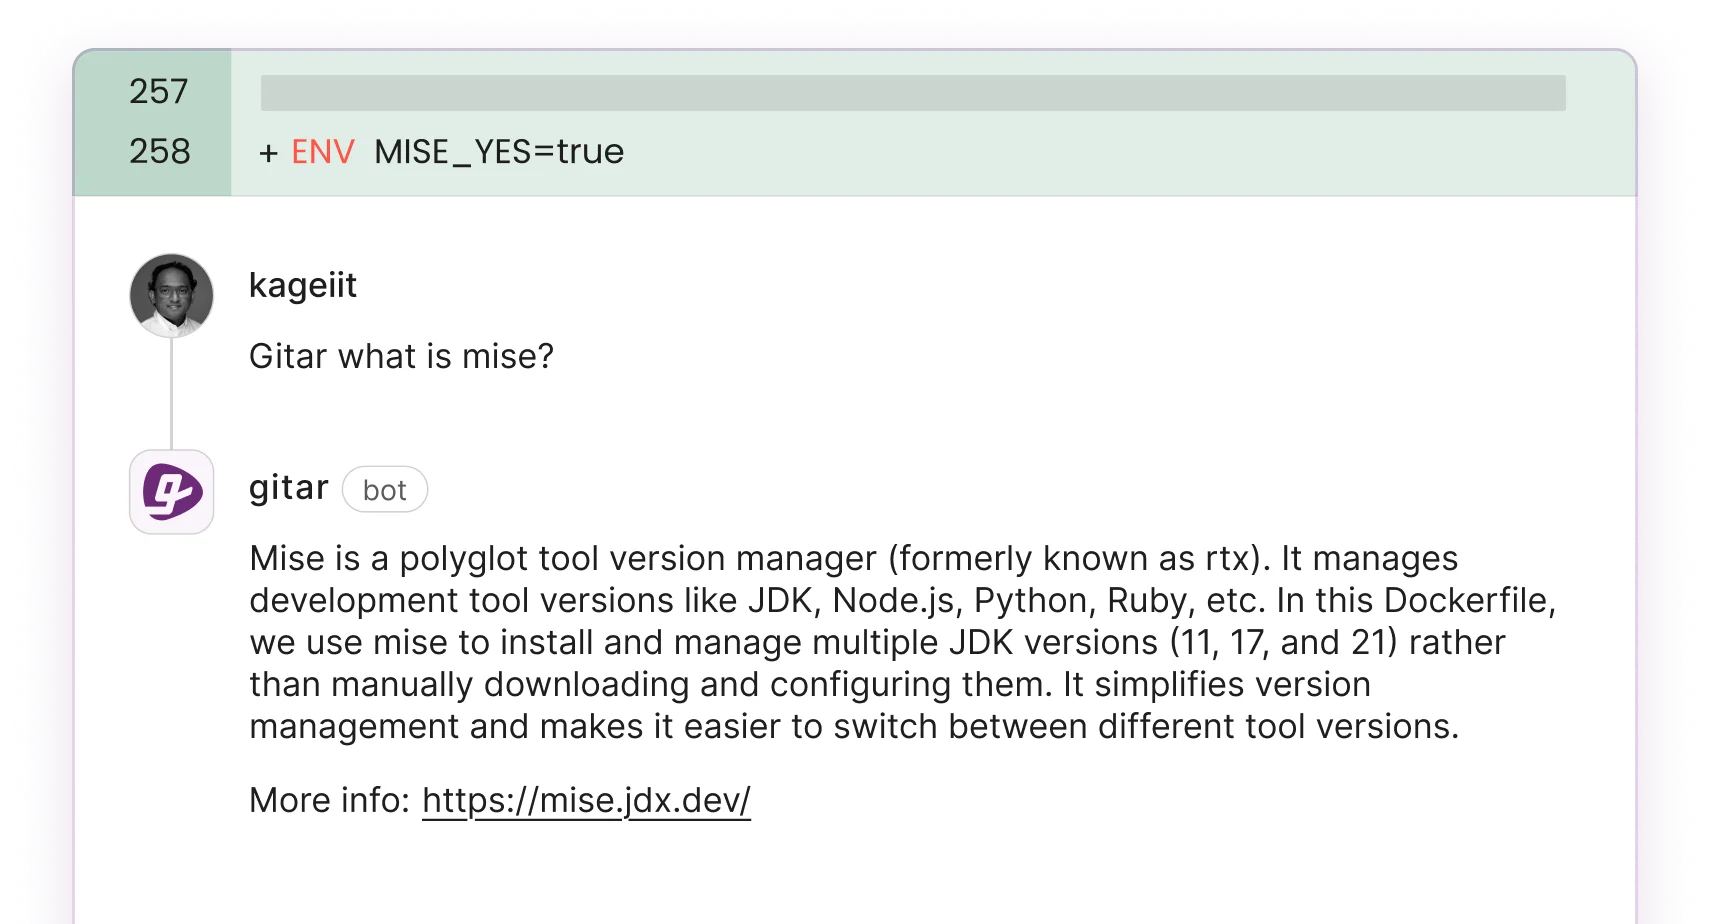
The platform consolidates all findings, including CI analysis, review feedback, and rule evaluations, into a single dashboard comment. This approach reduces notification spam and provides actionable intelligence across GitHub, GitLab, and CircleCI environments. The table below highlights the key capability gaps between suggestion-only tools and Gitar’s auto-fix approach, especially the difference between generating comments that require manual work and delivering guaranteed-green automated fixes.
|
Capability |
CodeRabbit/Greptile |
Gitar |
|
Auto-apply fixes |
No |
Yes (guaranteed green) |
|
CI failure auto-fix |
No |
Yes |
|
Single dashboard |
Noisy comments |
Yes, updating comment |
|
14-day Team trial |
Paid $15–30/seat |
Free, unlimited users |
Start tracking these metrics in your own environment with Gitar’s free 14-day trial, with comprehensive analytics available from day one.
9 Metrics That Show Code Review Automation Impact (With Baselines)
Effective measurement requires tracking metrics across three categories: quality, efficiency, and developer experience. The table below shows how each metric shifts from typical 2026 baselines to the improvements achievable with automated fixes, with many teams seeing 40–75% reductions in defect density, MTTR, and human toil that translate directly into cost savings.
|
Category/Metric |
Definition/Why Measures Impact |
2026 Baseline (Pre-Auto) |
Gitar-Powered (w/ Auto-Fixes) |
|
Quality: Defect Density |
Bugs/KLOC, catches AI logic issues early |
1/27 LOC baseline |
40% drop |
|
Quality: Escaped Bugs |
Post-merge bugs, DORA-tied quality gate |
25% reduction |
|
|
Quality: DORA Change Failure Rate |
Failed deploys, automation enforces standards |
15% CFR typical (per DORA report) |
<10% elite |
|
Efficiency: Cycle Time |
PR open-to-merge, scales review volume |
91% longer (12–24h) |
24% drop (Jellyfish) |
|
Efficiency: MTTR for CI Fixes |
CI recovery time, reduces toil |
1h/day/dev ($1M/yr) |
75% drop |
|
Efficiency: Human Toil Hours |
Manual fix and review time, frees humans |
30% dev time |
75% less |
|
DevEx: Review Fatigue Surveys |
NPS on toil, reduces burnout |
High (AI verification tax) |
+20% satisfaction |
|
DevEx: Notification Volume |
Alerts and PR noise, single comment wins |
Dozens per push |
1 consolidated |
|
DevEx: PR Revert Rate |
Reverts post-merge, validates fixes |
5–10% |
<2% |
These DORA metrics for code review provide comprehensive coverage of automation impact. The cycle time improvements shown in the table, such as the 24% reduction, align with broader industry patterns. Elite DORA-performing teams complete reviews in under 6 hours with pull requests under 400 LOC, and reducing average code review time from 48 hours to 12 hours can increase deployment frequency by 30%.
Common Metric Traps That Hide Real Automation Impact
Jellyfish warns that tracking individual AI usage metrics like suggestion acceptance rates acts as a vanity metric, leading developers to game the system by accepting poor suggestions. This behavior drops code quality, increases bugs, and prolongs review times. Similarly, lines of code metrics become meaningless when AI can generate 500 lines per hour that require extensive fixes, so raw volume no longer reflects real productivity.
Additional pitfalls include rubber-stamping due to confirmation bias, where reviewers assume AI-generated code is correct and approve it without scrutiny. That mindset prioritizes speed over quality and encourages shallow reviews. Over time, these habits inflate activity metrics while masking the real cost of rework, outages, and developer burnout.
Gitar’s validation engine prevents these traps by guaranteeing fixes work against CI before committing, which removes the false productivity gains from broken automation. The platform’s comprehensive analytics help teams measure real outcomes rather than vanity metrics, so leaders can see exactly how automation affects quality, speed, and developer experience.
Simple Impact Scorecard Template for Automation ROI
Once you have outcome-focused metrics that avoid these traps, translate them into financial impact using this ROI framework: (Annual time saved × hourly rate) / (Initial cost + ongoing maintenance). To translate the metrics above into financial impact, focus on the “Human Toil Hours” and “MTTR for CI Fixes” metrics from the table, since they directly represent time saved.
Calculate automation ROI using this framework: (Annual time saved × hourly rate) / (Initial cost + ongoing maintenance). To see how this works in practice, consider a 20-developer team spending 1 hour daily on CI and review issues at $100/hour, which creates a baseline cost of $520,000 annually. When automation reduces that toil by 75%, as shown in the metrics table, the team saves $390,000 per year before even counting the quality improvements and developer satisfaction gains that reduce attrition costs.
Track weekly improvements in cycle time, defect density, and developer NPS scores to keep the scorecard current. Baseline these metrics during your trial period to establish concrete before-and-after comparisons that justify continued investment in automation tooling.
Frequently Asked Questions
How to measure code review effectiveness?
Measure code review effectiveness using efficiency metrics such as cycle time and MTTR for CI fixes, quality metrics such as defect density, escaped bugs, and change failure rate, and developer experience metrics such as review fatigue surveys and notification volume. Focus on outcome-based measurements rather than activity metrics like PR counts. Establish baselines before implementing automation, then track improvements in review speed, code quality, and developer satisfaction. Combine quantitative metrics with qualitative feedback to confirm that automation delivers real value.
What are code review KPIs?
Essential code review KPIs include Time-to-Merge (target under 6 hours), PR Pickup Time (under 2 hours), defect density (1 defect per 27 lines baseline), change failure rate (under 15%), cycle time reduction, MTTR for CI fixes, human toil hours, review fatigue scores, notification volume, and PR revert rates. These KPIs span quality, efficiency, and developer experience categories to provide comprehensive visibility into review process health and automation impact.
DORA metrics for code review
DORA metrics for code review focus on deployment frequency, lead time for changes, mean time to recovery (MTTR), and change failure rate. Code review automation directly affects these metrics by reducing cycle times, which improves lead time, enabling faster CI recovery, which reduces MTTR, maintaining quality standards, which lowers change failure rate, and scaling review capacity, which increases deployment frequency. Track how review process improvements translate to better DORA performance across your delivery pipeline.
Conclusion: Baseline Your ROI with Proven Metrics
The most useful metrics for measuring the impact of code review automation give engineering leaders concrete data to justify automation investments and improve team performance. By tracking quality, efficiency, and developer experience metrics with clear baselines, teams can prove ROI while avoiding common measurement pitfalls.
Prove your automation ROI with Gitar’s free 14-day trial, which includes the metrics dashboard and auto-fix capabilities discussed above, along with guaranteed green builds from day one.