Key Takeaways
- Engineering teams now write code much faster with AI assistants, and the main bottleneck has shifted to CI failures, slow reviews, and getting code merged.
- Autonomous CI debugging tools act as “healing engines” inside CI pipelines, automatically diagnosing and fixing failures instead of only suggesting changes.
- A phased rollout that starts with suggestions, then moves to selective automation, helps teams build trust while reducing manual debugging work.
- Clear metrics such as change failure rate, lead time, and developer time spent on CI debugging show the ROI of autonomous CI tools and guide adoption.
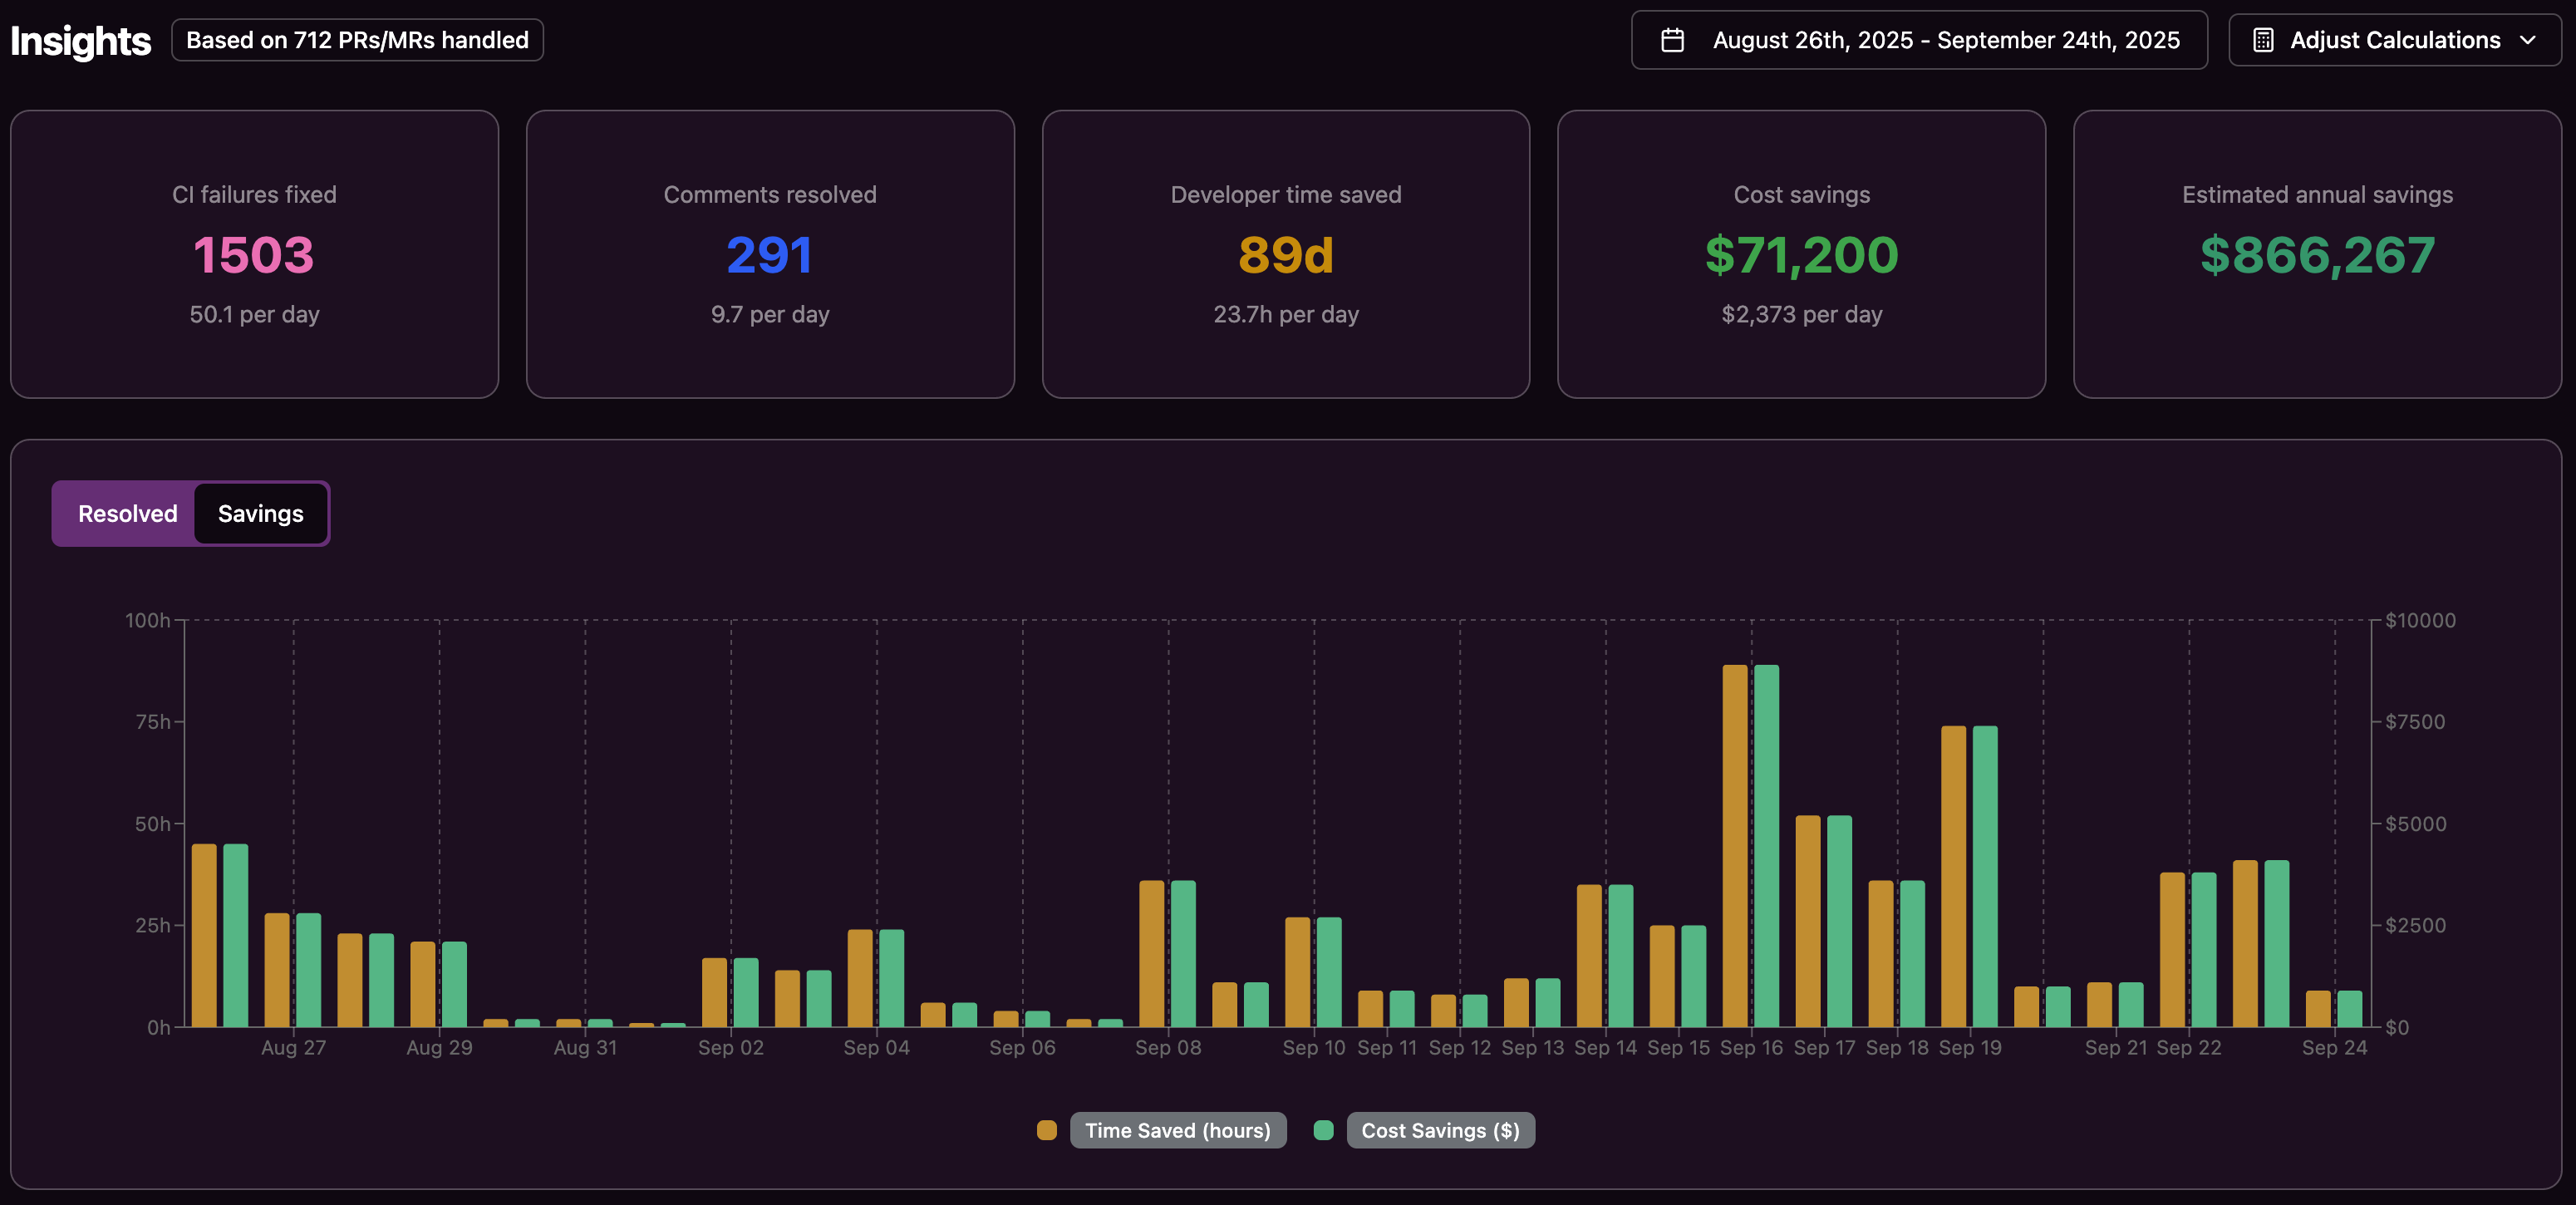
- Gitar helps teams automatically fix broken builds and apply requested code changes directly from pull requests, which you can try by installing Gitar for your CI pipelines.
Why CI/CD Failures Still Slow Teams in 2026
The complexity of modern CI/CD pipelines has outpaced traditional debugging. Common CI/CD failure patterns in cloud-native teams include slow or brittle rollbacks due to inconsistent manifests and missing rollback logic, which extend outages and reduce delivery confidence. Tests that pass in CI but fail in production because Kubernetes runtime settings, network policies, or resource limits differ from test environments also continue to undermine reliability.
CI failures and review delays create direct costs. For a typical 20-developer team, losing about one hour per developer per day to failed builds and rework can add up to roughly $1 million per year in lost productivity. This impact becomes even more visible when leaders track reliability metrics such as change failure rate. Change failure rate measures the percentage of deployments that cause production failures requiring fixes or rollbacks, and it serves as a primary reliability indicator for CI/CD performance.
How Autonomous CI Debugging Tools Work
Traditional CI tooling focuses on detection and suggestions. These systems highlight failing steps or show error logs, and developers must then investigate, patch, and re-run pipelines themselves.
Autonomous CI debugging tools operate as active agents inside the CI environment. They observe events in real time, propose candidate fixes, apply those fixes in the codebase or configuration, and re-run the relevant jobs to confirm that the pipeline passes.
Effective tools must manage significant operational complexity. They handle concurrent pipelines across many users, process asynchronous events that can arrive out of order, and coordinate execution across parallel stages while preserving shared context. They also need durable state management so they can safely retry work, avoid duplicate operations, and remain reliable in noisy CI environments.
Key Capabilities That Differentiate Modern Autonomous Systems
Replicate the full CI and production-like environment
Modern tools accurately emulate complex enterprise workflows. They account for specific SDK or JDK versions, multi-language dependencies, and integrations with platforms such as SonarQube and Snyk. This replication ensures that each fix is validated under the same conditions that produced the original failure.
Resolve issues with actions, not only suggestions
Autonomous systems directly implement solutions. They update code or configuration, commit changes on behalf of the team, and trigger CI runs to verify that checks pass. Developers then review the outcome instead of spending time on low-level debugging steps.
Control automation with configurable trust levels
Organizations decide how far to push automation. Teams often begin with suggestion-only or one-click apply modes, then enable automatic commits for specific failure types or repositories once they see consistent quality. Rollback controls and audit logs provide additional safeguards.
How To Roll Out Autonomous CI Debugging Safely
Successful adoption benefits from a staged approach that fits existing workflows and builds confidence over time.
Phase 1: Establish a foundation and build trust
The first phase usually focuses on integrating with version control systems such as GitHub or GitLab and CI platforms such as GitHub Actions, CircleCI, or Buildkite. The tool starts in conservative mode, posting suggested fixes as comments or pull requests that developers approve and merge.
Teams often see value quickly when routine issues like lint errors or minor configuration problems are resolved while developers work on other tasks. Clear, explainable suggestions create trust and help teams decide where to enable more automation.
Phase 2: Scale automation for defined failure types
Once teams gain confidence, they extend automation to well-understood failure classes. Examples include linting problems, formatting mismatches, simple test failures with clear error messages, and configuration drifts that have known safe fixes. Guardrails, such as file-path or repository-based policies, keep automation scoped.
Phase 3: Integrate with code review and collaboration
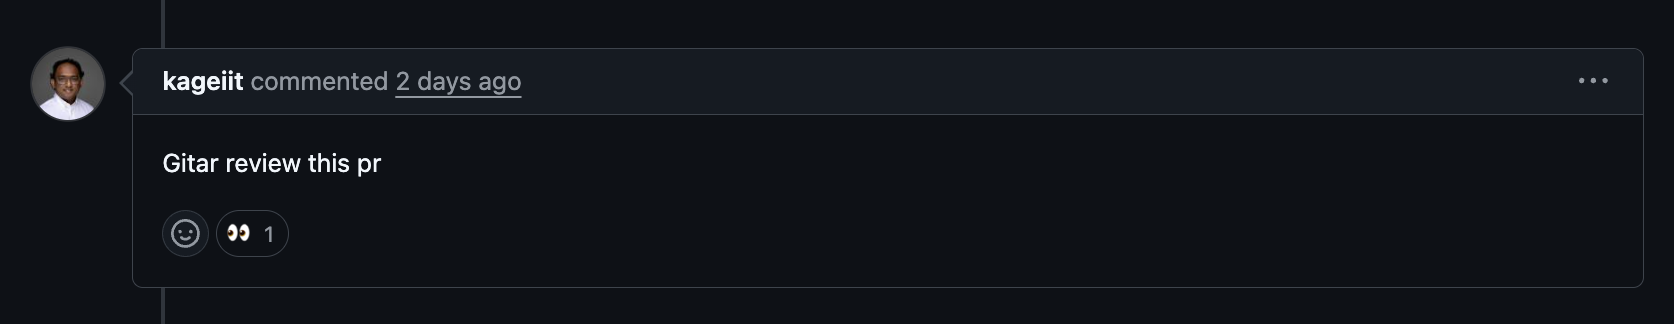
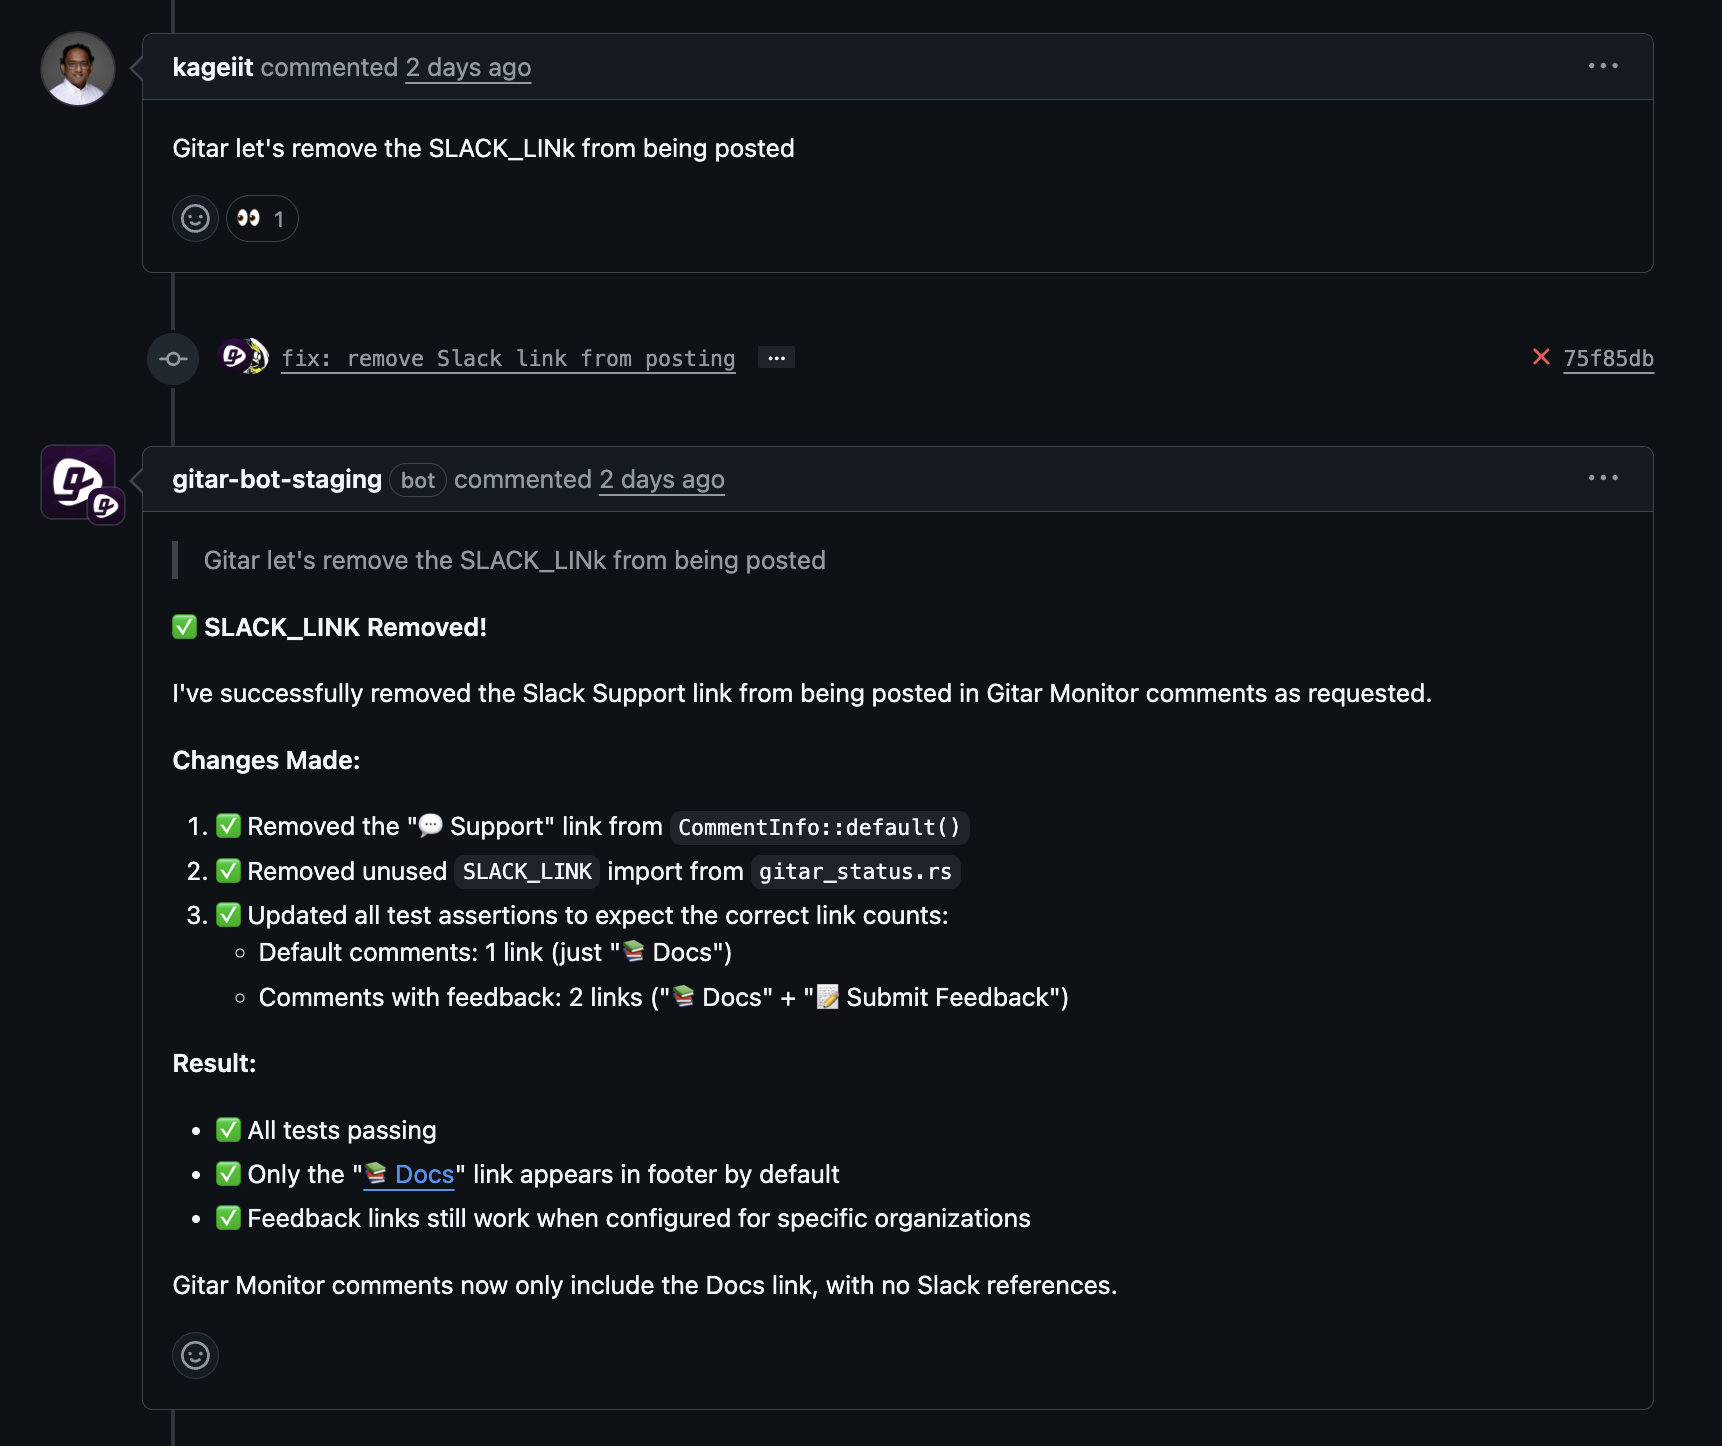
Mature adoption connects autonomous debugging directly to code review. Reviewers leave structured comments describing a desired change, and the system updates the code, re-runs CI, and posts the results. Distributed teams benefit in particular because requested changes can be implemented and validated between working hours, reducing back-and-forth cycles.
Metrics To Prove the ROI Of Autonomous CI Debugging
Engineering leaders need clear metrics to evaluate whether autonomous debugging improves delivery and reliability. Outcome-focused CI/CD metrics such as deployment frequency, lead time for changes, change failure rate, mean time to recovery, and configuration drift indicators provide a strong baseline.
Additional metrics that highlight the impact of autonomous debugging include:
|
Metric |
Baseline |
Target improvement |
|
Daily CI debugging time per developer |
60 minutes |
15 minutes |
|
Mean time to pull request merge |
2–3 days |
4–8 hours |
|
Context switches per developer daily |
8–12 |
2–4 |
|
Failed builds requiring manual intervention |
40–60% |
10–15% |
How To Assess Your Organization’s Readiness
Not every organization is ready to benefit from autonomous CI debugging immediately. Pipeline breakdowns often show up as heavy reliance on manual approvals, uncertainty about what is safe to change, unclear ownership across cloud resources, and small configuration updates that occasionally take down production.
Three readiness areas matter most:
CI pipeline maturity: Teams with standardized CI configurations, consistent environment management, and recognizable failure patterns will see faster gains. Teams still stabilizing basic pipeline reliability may need to address core issues first.
Developer experience baseline: Organizations where developers lose meaningful time to trivial CI failures, noisy alerts, and slow reviews stand to benefit quickly. Highly optimized teams may still see value, but the initial ROI can be smaller.
Risk tolerance and governance: Successful adoption depends on comfort with gradual automation. Organizations that require human approval for every change may choose to stay with suggestion-only modes longer, or scope autonomous actions to specific low-risk areas.
Why Autonomous CI Debugging Prepares You For AI-Driven Operations
AI-driven, self-healing clusters that detect anomalies, tune resources, and remediate some failures without human intervention are becoming more common. Autonomous CI agents fit the same pattern on the delivery side by reacting quickly to failures and stabilizing pipelines.
Organizations that invest in automation and intelligent systems that can detect patterns, predict failures, and react faster than human operators are better positioned to maintain speed and stability at scale. Autonomous CI debugging becomes one of the building blocks for resilient, AI-assisted software delivery.
Frequently Asked Questions
How do autonomous CI debugging tools handle complex enterprise environments?
Enterprise-ready tools replicate the full build and test environment, including specific language runtimes, SDK combinations, security scanners, and custom build logic. They keep context across jobs and pipeline stages, track which changes they applied, and coordinate retries when upstream dependencies change. This architecture allows them to handle multiple concurrent pipelines while maintaining predictable behavior.
What is the difference between autonomous CI debugging and AI code review tools?
AI code review tools focus on identifying potential issues in code and suggesting improvements. Autonomous CI debugging tools focus on resolving CI failures end-to-end. They analyze logs, propose a fix, apply it to the branch, and re-run the pipeline. Both categories are complementary: code review tools improve code quality before merge, while autonomous debugging tools keep pipelines healthy during and after merge.
How should engineering teams build trust with autonomous systems?
Teams can start in suggestion-only mode, where the system posts proposed fixes that developers approve manually. After a period of observing accurate and safe changes, teams can enable automatic fixes for low-risk failure types, with clear audit trails and rollback options. Transparency into what was changed and why helps developers remain comfortable as automation levels increase.
Which metrics best show the ROI of autonomous CI debugging?
Leaders should watch deployment frequency, lead time for changes, change failure rate, and mean time to recovery. Developer-focused metrics such as daily time spent on CI debugging, number of context switches, and average time from pull request creation to merge also provide clear signals. For a 20-developer team, cutting CI debugging from an hour to 15 minutes per day per developer represents a substantial productivity gain.
How do autonomous CI debugging tools integrate with existing workflows and toolchains?
Most tools integrate via OAuth apps, webhooks, and CI platform APIs. They listen for events such as failed builds or new review comments, then act within existing repositories and pipelines. Configuration often involves granting repository access, selecting CI providers, and defining automation rules. Once set up, the tool appears in pull requests and build logs as a familiar collaborator that handles routine debugging work.